Getting Started
Welcome
What is SynergyFinder?SynergyFinder is a stand-alone web-application for interactive analysis and visualization of multi-drug (2 or more drugs) multi-dose combination response data.
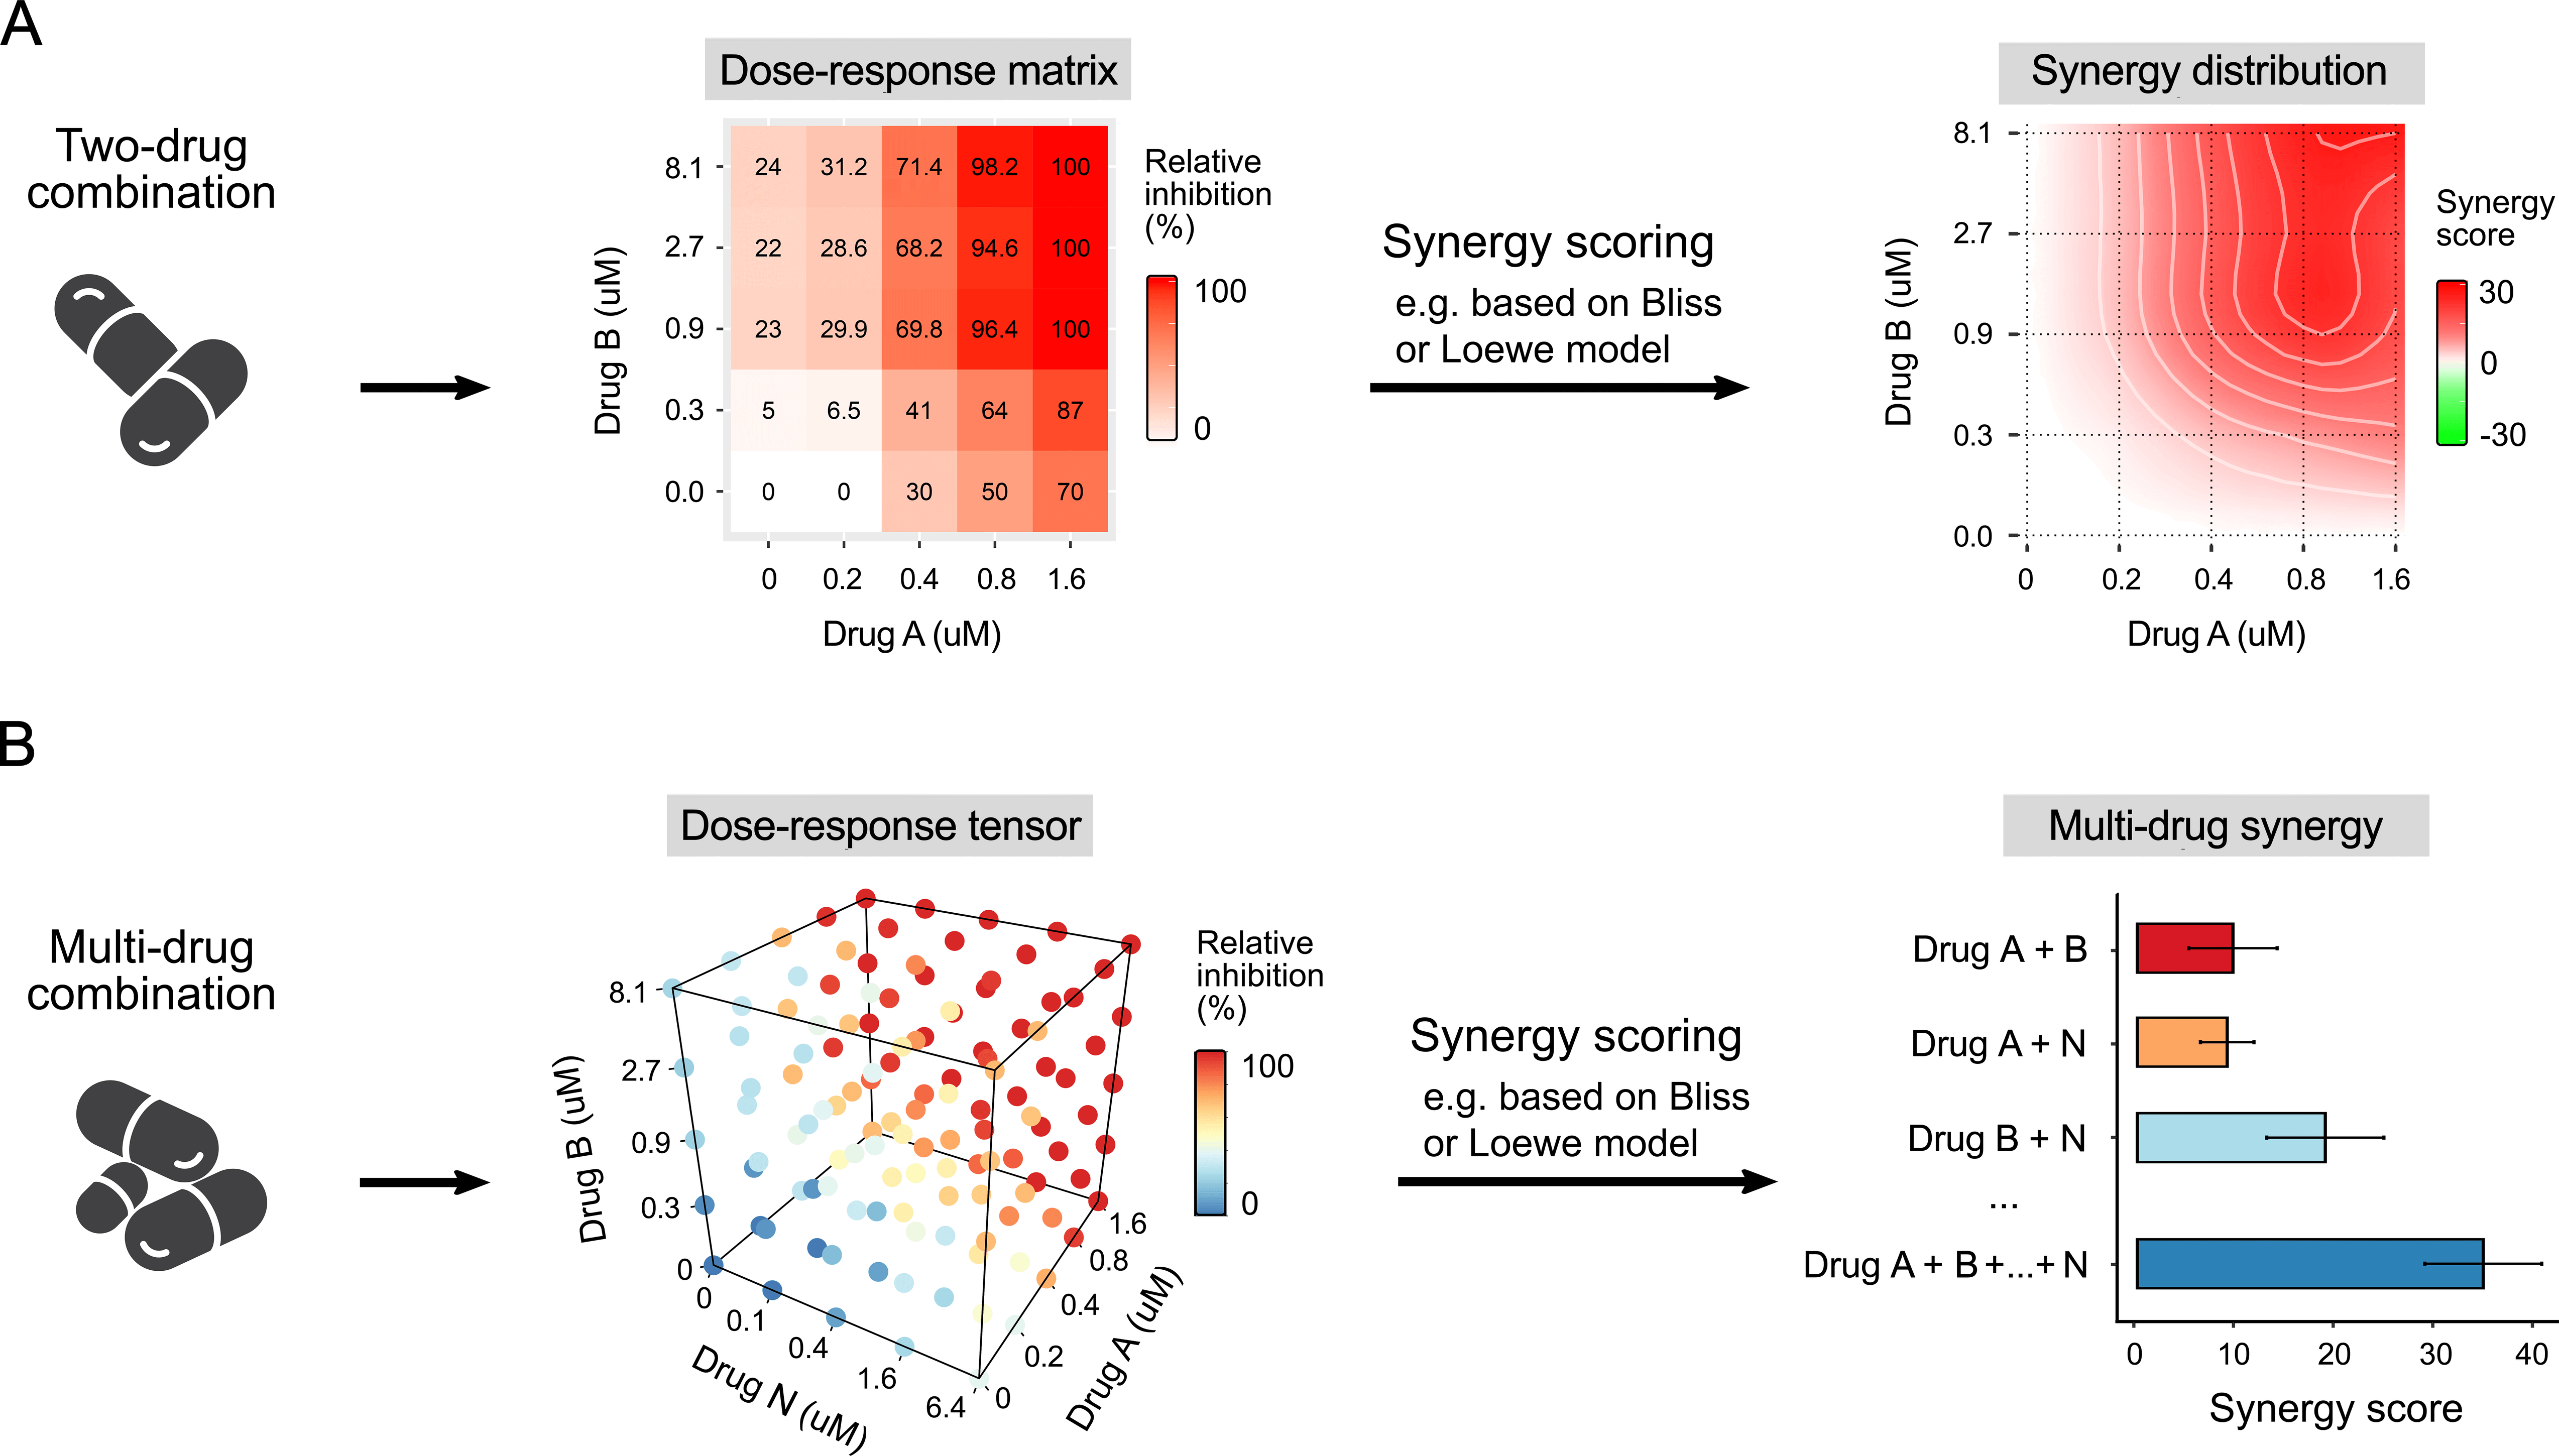 To evaluate the potential synergy of combined drugs, the observed drug combination responses (e.g. dose-response matrix or tensor, see figure above) are usually compared with expected combination responses calculated by means of synergy scoring models (so-called reference or null models).
Consequently, based on deviation of observed and expected responses one can classify the drug combination either as synergistic (i.e. combination effect is higher than expected) or antagonistic (i.e. combination effect is lower than expected).
To help researchers to analyse their drug combination profiling data, we have developed a browser-independent web application called SynergyFinder which provides not only the flexibility of using multiple synergy scoring models, but also a user-friendly interface to visualize and explore the drug synergy landscapes (see figure above) in an interactive manner.
SynergyFinder also nprovides automated outlier detection procedure, extended curve-fitting functionality, statistical assessment of replicate measurements, as well as different summary reports and tables.
To evaluate the potential synergy of combined drugs, the observed drug combination responses (e.g. dose-response matrix or tensor, see figure above) are usually compared with expected combination responses calculated by means of synergy scoring models (so-called reference or null models).
Consequently, based on deviation of observed and expected responses one can classify the drug combination either as synergistic (i.e. combination effect is higher than expected) or antagonistic (i.e. combination effect is lower than expected).
To help researchers to analyse their drug combination profiling data, we have developed a browser-independent web application called SynergyFinder which provides not only the flexibility of using multiple synergy scoring models, but also a user-friendly interface to visualize and explore the drug synergy landscapes (see figure above) in an interactive manner.
SynergyFinder also nprovides automated outlier detection procedure, extended curve-fitting functionality, statistical assessment of replicate measurements, as well as different summary reports and tables.
For more details, please refer to [Ianevski A, Giri AK, Aittokallio T. SynergyFinder 2.0: visual analytics of multi-drug combination synergies. Nucleic Acids Res. 2020 Jul 2;48(W1):W488-W493. doi: 10.1093/nar/gkaa216] and SynergyFinder 3.0 paper: https://doi.org/10.1093/nar/gkac382.
Reference models
The degree of combination synergy, or antagonism, is quantified by comparing the observed drug combination response against the expected response, calculated using a reference model that assumes no interaction between drugs.
The commonly-used reference models include the highest single agent (HSA), Bliss, Loewe, and Zero interaction potency (ZIP) model.
These models quantify the degree of synergy either as the excess over the maximum single drug response (HSA), multiplicative effect of single drugs as if they acted independently (Bliss), expected response corresponding to an additive effect as if the single drugs were the same compound (Loewe), and expected response corresponding to the effect as if the single drugs did not affect the potency of each other (ZIP).
More specifically, the following formulations are used to quantify the drug combination synergy (S) for the measured multi-drug combination effect of N drugs EA,B,…,N :
- HSA
HSA model is one of the simplest reference models, which states that the expected combination effect is the maximum of the single drug responses at corresponding concentrations. Thus, HSA synergy score, SHSA, is defined as: - Bliss
The Bliss independence model assumes a stochastic process in which two drugs elicit their effects independently, and the expected combination effect can be calculated based on the probability of independent events. Thus, Bliss synergy score, SBliss, is defined as:
SBliss = EA,B,…,N - 100(1 - (1 - EA 100 )(1 - EB 100 )...(1 - EN 100 )),
- Loewe
The Loewe additivity model calculates the expected response as if both drugs are the same. Hence, a slice through the response surface at any chosen effect should show a linear relationship between the doses of the two drugs. For example, if 50% inhibition is achieved separately by 1 μM of drug A or 2 μM of drug B, a combination of 0.5 μM of A and 1 μM of B should also inhibit 50%. In mathematical terms, if drug dose a' of drug A produces the same effect as dose b' of drug B, any dose combinations (a, b) fo which a a' + b b' = 1, must produce the same effect as a' and b'. Here, a' and b' can be replaced with the inverse of log-logistic models fa-1(E) and fb-1(E) respectively for effect E. - ZIP
The Zero interaction potency (ZIP) model captures the drug interaction relationships by comparing the change in the potency (effect at certain dose level) of the dose–response curves between individual drugs and their combinations. ZIP assumes that two non-interacting drugs are expected to incur minimal changes in their dose–response curves. The formulation of the model can be found at https://www.ncbi.nlm.nih.gov/pmc/articles/PMC4759128/. ZIP model takes the advantages of both the Loewe additivity and the Bliss independence models, aiming at a systematic assessment of various types of drug interactions patterns that may arise in a high-throughput drug combination screening. In short, the following formulation is used to quantify ZIP synergy score for the measured multi-drug combination effect EA,B,…,N :SBliss = A,B,...,N - (Σ - Σ A × B 100 + Σ A × B × K 10000 - ... ± A × B × ... × N 100(N-1) ),
which is analogous to the Bliss equation, but employs fitted drug responses instead of observed ones. Here, N is a dose-response curve-fitted N-th drug response at dose x given by the formula (xN / mN)λ 1 + (xN / mN)λ , and A,B,...,N is the fitted combination response derived by averaging N fiited responses obtained by fitting dose-response curves in each dimension of the measured combinatorial sub-tensor, i.e. (ΣA,B,...,N E'min + (xN / m'N)λ' 1 + (xN / m'N)λ' ) / N.
Thus, ZIP is used as a default model in SynergyFinder. However, one should note that ZIP model's accuracy (as well as Loewe model) heavily relies on the dose-response curve-fitting. Issues with data quality or incorrect dose-response assumptions can result in unreliable synergy estimations. For example, non-logistic dose-response patterns, such as U-shaped relationships observed in individual matrix rows/columns can highlight these limitations. This emphasizes the need for considering multiple synergy scoring models alongside default ZIP model for a more comprehensive synergy evaluation.
SHSA = EA,B,…,N - max(EA, EB,…, EN),
where EA,B,…,N is the combination effect between N drugs and EA, EB,…, EN are the measured responses of the single drugs.
Here, terms (1 - EA,B,...,N 100 ) represent probabilities that drugs A,B,...,N do not inhibit the target. Thus, multiplication of these terms results in the probability that none of the drugs inhibit the target. Subtracting this probability from 1, 1 - (1 - EA 100 )(1 - EB 100 )...(1 - EN 100 )), gives the probability that at least one of the drugs inhibits the target, which is equivalent to the Bliss effect.
Interestingly, Bliss effect can also be repsresented with equivalent extended formula, as a combination of individual drug effects and their interactions:
SBliss = EA,B,...,N - (ΣE - Σ EA × EB 100 + Σ EA × EB × EK 10000 - ... ± EA × EB × ... × EN 100(N-1) ),
Although both formulas may look different, they are mathematically equivalent and will yield the same value for the Bliss effect. For example, for a 3-drug combination, with each drug responses equal to e.g. EA = 35% inhibition, EB = 57% inhibition, EN = 44% inhibition, and combination effect EA,B,...,N = 93% inhibition, based on probabilistic equation, Bliss synergy score (SBliss) equals to 93 - 100(1 - (1- 35 100 )(1- 57 100 )(1- 44 100 )) = 8.652
The extended formula provides exactly the same results: SBliss = 93 - (35 + 57 + 44 - 35 × 44 100 - 57 × 44 100 - 35 × 57 100 + 35 × 44 × 57 10000 ) = 8.652
Of note, SynergyFinder uses a probabilistic formulation in the code implementation, while extended formula is shown in our SynergyFinder 2.0 publication.
Thus, for any doses xA, xB, ..., xN of drugs drugs A,B,...,N, Loewe synergy score, SLOEWE, is defined as:
SLOEWE = EA,B,…,N - ELOEWE,
where ELOEWE should satisfy: Σk = A,B,...,N ( xk fk-1(ELOEWE) ) = 1.
SynergyFinder input and output
SynergyFinder input
For an easier user experience, two possible input file formats (Table and Matrix) are allowed in SynergyFinder. Therefore, the same input data can be provided in the two alternative formats.
Example data are available on the website by clicking Example data button.
Please note, that we highly recommend not to use following special characters in the uploded file name as well as drug names colon, semicolon, underscore, comma, slash and dot as those may cause unexpected app crash.
a. Table format
In the Table format, the input dose-response matrix is represented as a table where each row contains the information about one cell in the combination dose-response matrix.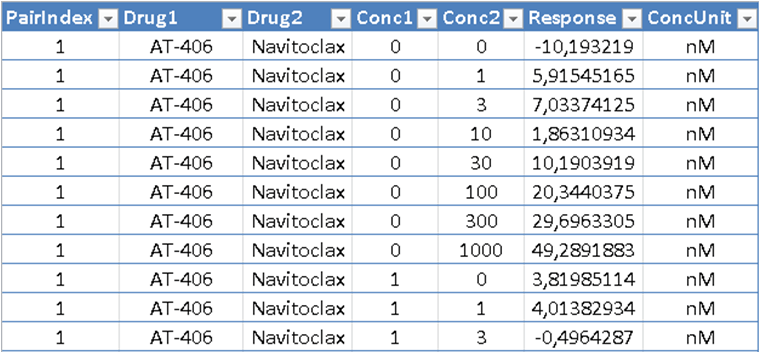 The input table must comprise the following columns:
- PairIndex - index of drug-combination to be analyzed (starts from 1)
- Response - %inhibition or %viability values
- Drug1 – name of the first drug
- Drug2 – name of the second drug
- Conc1 - concentration of Drug1
- Conc2 - concentration of Drug2
- ConcUnit - unit of concentration
For higher-order drug combinations (3 or more drugs) additional information (Drug and Conc) on each compound should be provided.
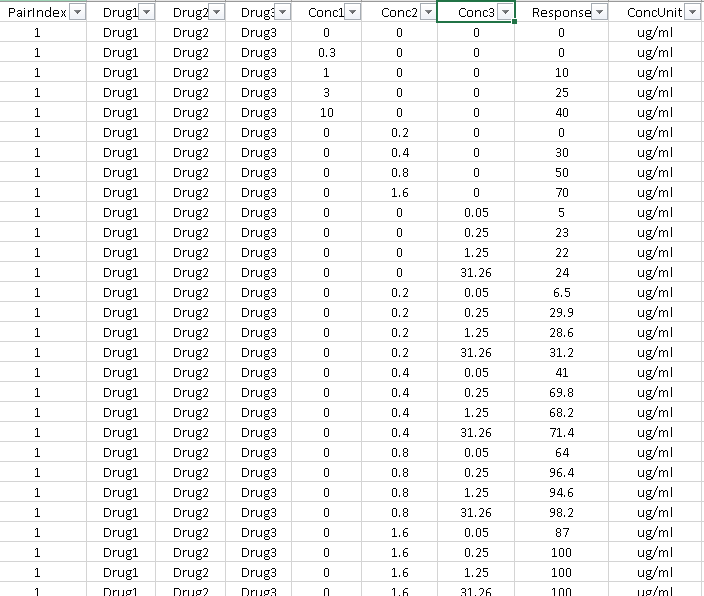 The expected file extensions are either *.xlsx, comma-delimited *.csv, or comma-delimited *.txt file (see example data).
b. Matrix format
The matrix format is supported only for two drug combinations. In the Matrix format, the dose-response matrix is represented in a matrix form with drug concentrations shown along the top and left side of the matrix.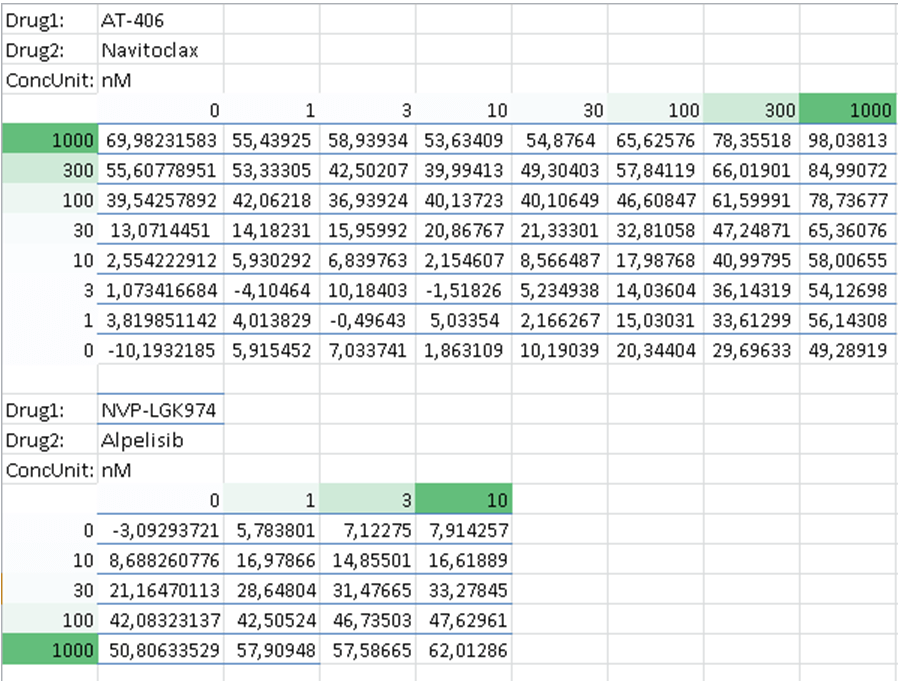
The three rows should precede each dose-response matrix:
- Drug1: name of the first drug
- Drug2: name of the second drug
- ConcUnit: unit of concentration
Parameter selection
Choosing readoutAfter uploading an input data file, the user needs to specify the specific type of phenotypic response (either %inhibition or %viability). 
The drug combination responses provided in the input file must be normalized to %inhibition of cell viability or proliferation based on the positive and negative controls. For a well-controlled experiment, the range of the response values is expected to be between 0 and 100. However, missing values or extreme values are allowed. For input data where the drug effect is represented as %viability, the program will internally convert it to %inhibition value by 100-%viability transformation.
Simply put, %inhibition responses are usually around zero at the lower doses of drugs, and around the maximum values at the highest doses. In case your data follow the opposite patter, please select the %viability type of phenotypic response.
Selecting curve-fitting algorithmA four-parameter logistic regression (LL4) is the default option (recommended) for curve-fitting algorithm which is used to fit single-drug dose-response curves. 
LL4 is highly recommended as being the most commonly-used curve-fitting model. However, in some cases, drug dose-responses may not accurately follow the sigmoidal pattern (e.g. U-shaped dose-response curves), and in such cases users may select LOESS fit (LOESS) or linear regression (LM) as alternative algorithms for curve fitting.
Outlier detectionFor automated detection of outlier measurements both in the combination and individual agent dose-response measurements, SynergyFinder utilizes the recently-developed machine learning model, based on composite non-negative matrix factorization (cNMF) algorithm (10.1038/s42256-019-0122-4).
By default, the Detect outlier option is turned on to allow automatic outlier identification.
When an outlier is detected, SynergyFinder displays the following warning, as an indication a drug combination and drug doses (in brackets) at which outlier was detected.

In order to remove outlier measurement, please choose concentrations of both drugs in the Estimate missing responses or outliers panel.
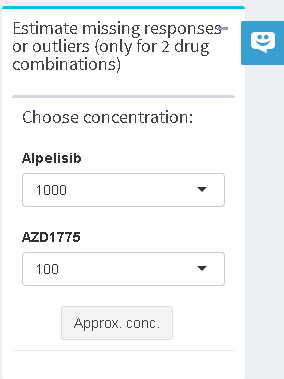
cNMF algorithm will capture the overall drug combination dose-response matrix pattern and return the predicted value, which will replace the outlier. See the example below, where an outlier - Alpelisib (1000 nM) and AZD1775 (100 nM) - was replaced by cNMF.
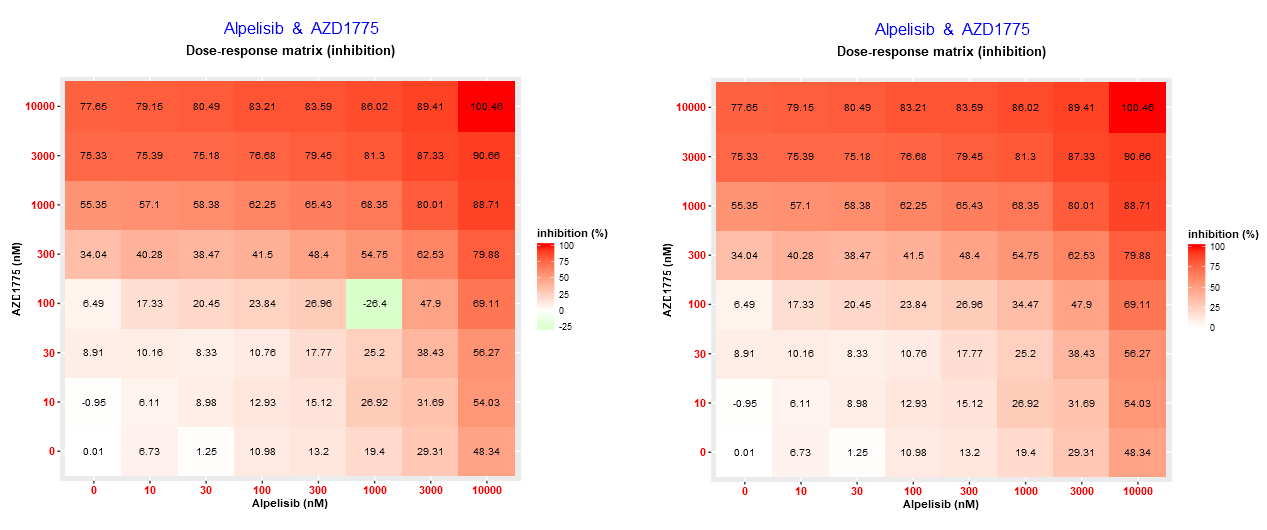
In case of replacing outlier measurement or predicting the missing response please also cite cNMF method, see citation examples here.
Interpretation of the results
Visualization of input dose-response dataVisualization of input dose-response data is done by switching on the corresponding toggle button. It will give the user an overview of the full dose-response data, as well as dose-response plots of phenotypic responses for the single drugs (i.e. response measurements, when the other drug doses are zero), fitted by four-parameter logistic curve or any other selected algorithm.
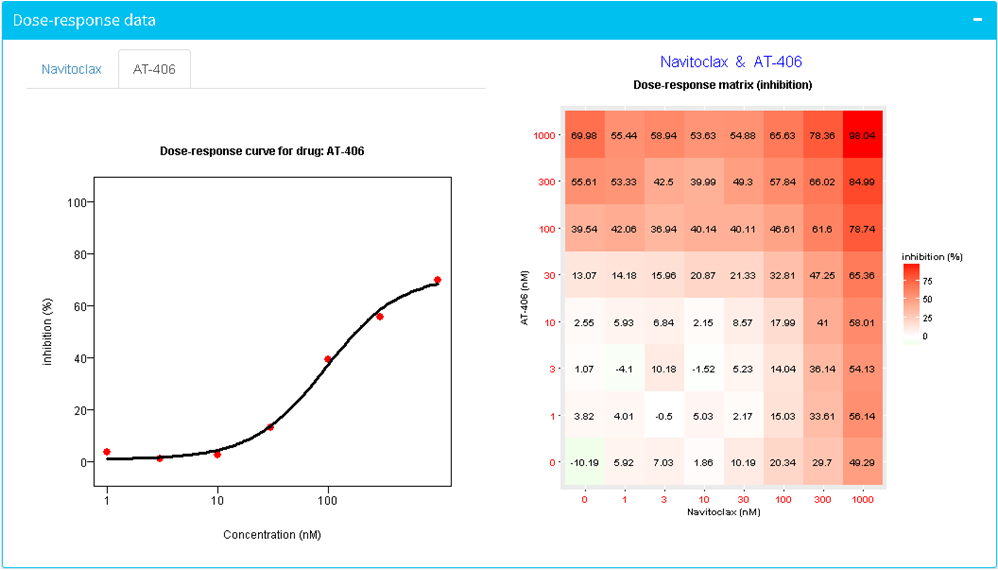
The visualization enables the user to identify any problematic data points, such as negative phenotypic responses or outliers and to investigate the overall pattern of the combination data.
The 'Correction' option is available to apply a base-line correction, which helps minimize the impact of problematic data points in the subsequent synergy scoring steps. It should be used only in cases of obvious low-quality data where the baseline is shifted, meaning that single drug responses (especially at lower doses) are much lower than 0% inhibition. By default the correction parameter is now turned off and in this case SynergyFinder implements only partial correction (of negative values).
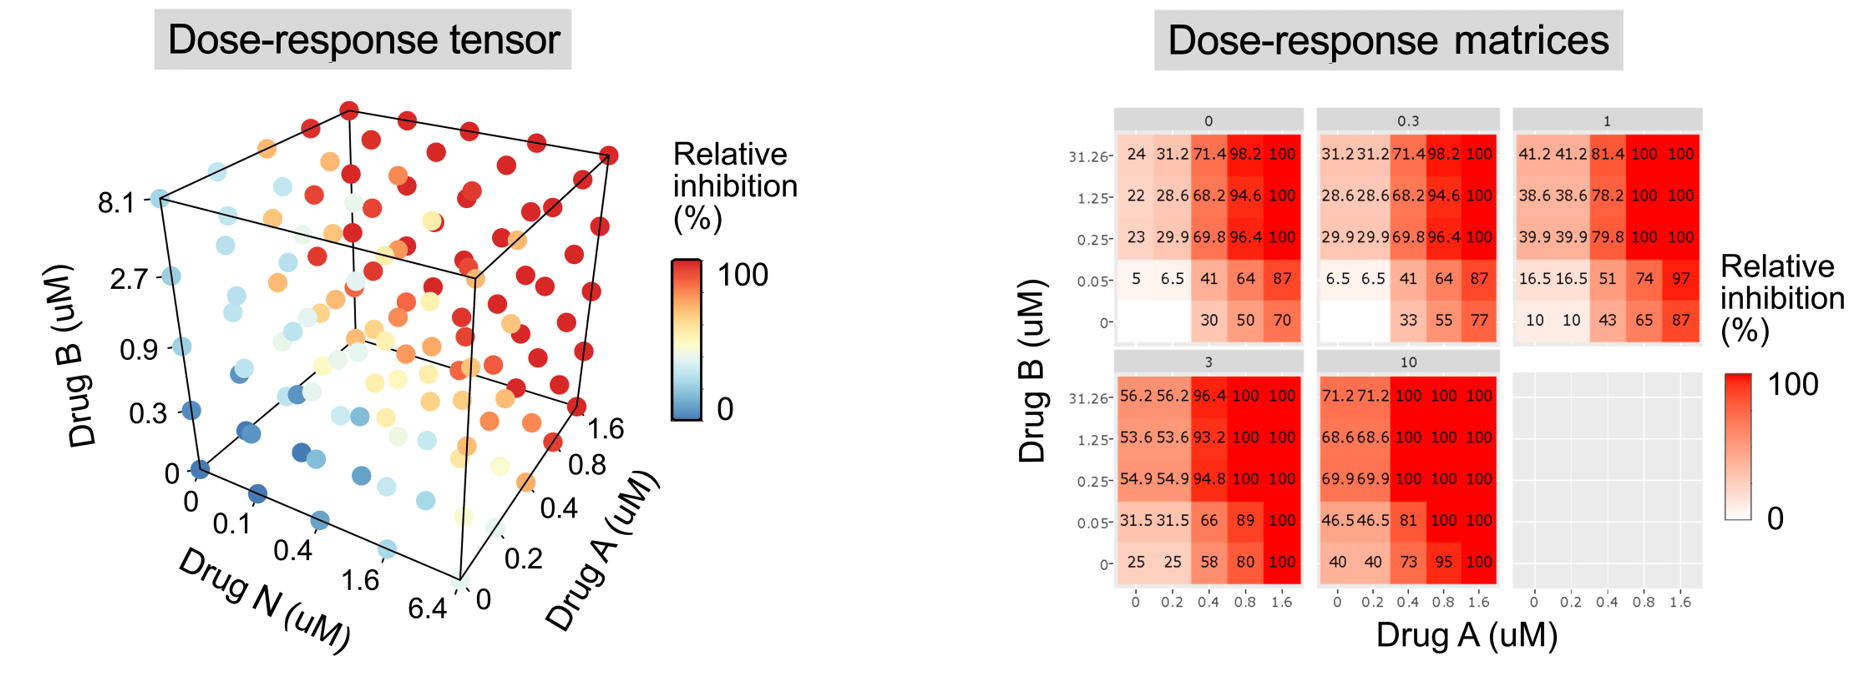
For multi-drug combination analysis, for more >2 drugs, a dose-response tensor is used to display input dose-response data. Such higher-order response data can be displayed either as tensor or as a set of dose-response matrices, where each matrix corresponds to one dose of N-th drug.
Calculation and visualization of synergy scores
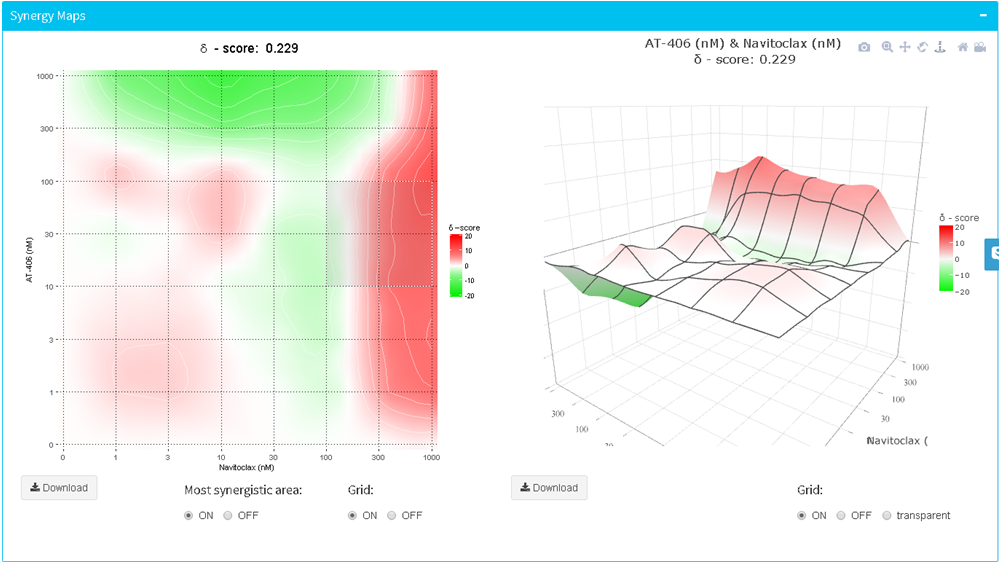
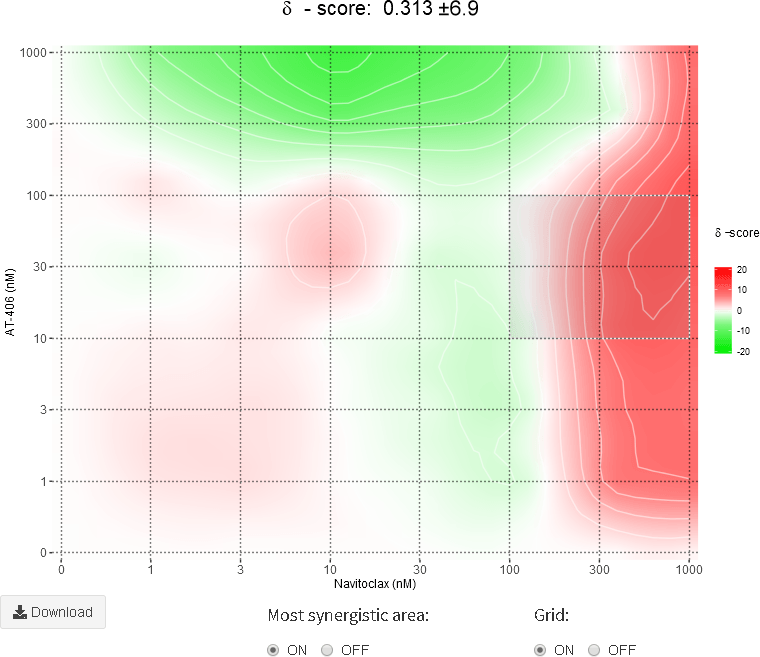
The calculation of synergy scores and visualization of synergy maps is done by switching on the corresponding toggle button. The summary synergy score for a drug combination is averaged over all the dose combination measurements. The 2D and 3D synergy maps highlight synergistic and antagonistic dose regions in red and green colors, respectively. SynergyFinder also helps to find the most synergistic area (MSA score) in the synergy interaction map. In a 3D synergy map users are provided with possibilities to (i) rotate, (ii) zoom, (iii) hover over to show synergy scores for any part of the synergy map and (iv) save the resulting image as HTML, PNG or SVG. In a 2D synergy map it also allows zooming into specific regions by brushing and double-clicking. After zooming the synergy score will be recalculated for the chosen area.
In case of multi-drug combinations of >2 drugs, an additional barplot is displayed showing synergy scores for all the combinations and sub-combinations. By comparing those synergy scores one can understand the contribution of each drug in a cocktail to the joint combination response.
The summary synergy scores can be interpreted as the average excess response due to drug interactions (i.e. synergy score of 15 corresponds to 15% of response beyond expectation). There is no particular threshold to define a good synergy score, since combination synergy is highly context-specific. However, based on our experience, the synergy scores near 0 gives limited confidence on synergy or antagonism. So when synergy score:
- Less than -10: the interaction between two drugs is likely to be antagonistic;
- From -10 to 10: the interaction between two drugs is likely to be additive;
- Larger than 10: the interaction between two drugs is likely to be synergistic.
SynergyFinder 3.0 provides a novel synergy scoring method (called Bliss/Loewe consensus) that combines multiple synergy reference models (Bliss, Loewe, and HSA), both for pairwise and higher-order combination data. The ZIP synergy model was not included in the consensus scoring as it shares the same multiplicative survival principle as Bliss model, thereby potentially biasing the consensus synergy interpretation. More specifically, the web-app quantifies the expected combination effect based on all the three reference models, and then calculates a consensus distribution that is the maximum expected combination effect among the models at each drug combination dose pair. We note, that even if some combinations are not consistently identified by Bliss/Loewe consensus model as synergistic, they may still show true synergy that was not captured by this consensus scoring. Therefore, the primary aim of such consensus scoring is to eliminate those false positive synergy cases, where a user has selected a potentially biased reference model that best supports his/her expectations. We recommend one to calculate consensus synergy score for all identified top-synergistic combinations, and then further investigate (and potentially de-prioritize) those that show Bliss/Loewe synergy less than –5.
Post-analysis options
SynergyFinder 3.0 also implements several post-analysis options that enable one to explore and better interpret the identified synergistic combinations
Weighting synergy by concentrationsSynergyFinder allows to weight synergy by concentrations, hence highlighting combinations that show synergy at lower dose windows, since those combinations are less likely to lead to toxic responses. Since drug concentration ranges are often heterogeneous across the drugs in combination assays, SynergyFinder does not directly utilize drug doses, but rather the proportion of response values of single-agents at each dose. In this way, SynergyFinder implicitly favours synergy at lower concentrations without the need to utilize the real drug concentration levels. One can export the weighted synergy scores by clicking "Save full report" on the main page, and downloading table file from "Synergy scores" section.
Visualizing dose-response curves and distinguishing between different synergy types
We incorporated a recently-introduced parametric synergy model, Multi-dimensional Synergy of Combinations (MuSyC) reference model, since it provides the users with the possibility to explore whether the observed synergy is due to enhanced potency and/or efficacy or both (cooperativity) of the single agents. We recommend runing this option, when a strong synergy or antagonism is observed to get a more detailed interpretation of drug combination synergy/antagonsim observed. In addition, SynergyFinder shows combination dose-response curves for visual interpretation of MuSyC conclusions. If the users are not intersted in MySuC results, they can just use combination dose-response curves visualization.

One can try this option by clicking "Save full report" on the main page, and downloading the report from "Synergy interpretation (MuSyC model + dose-response plots):" section.
Replicate analysis
In case SynergyFinder detects replicated data (i.e. multiple measurements for the same drug-dose pairs), it calculates various statistical metrics as well as 95% Confidence Interval (95% CI) for the summary synergy scores.
More specifically, SynergyFinder uses all the repeated measurements to fit a more robust dose-response curve (See figure below, left panel). For visualization of the combination measurement replicates, SynergyFinder displays the median value of each measurement on the dose-response tensor/matrix as well as
standard deviation (SD), standard error of the mean (SEM) or 95% Confidence Interval (95% CI) based on the user's choice. See small numbers below dose-response values (Figure below, right panel).
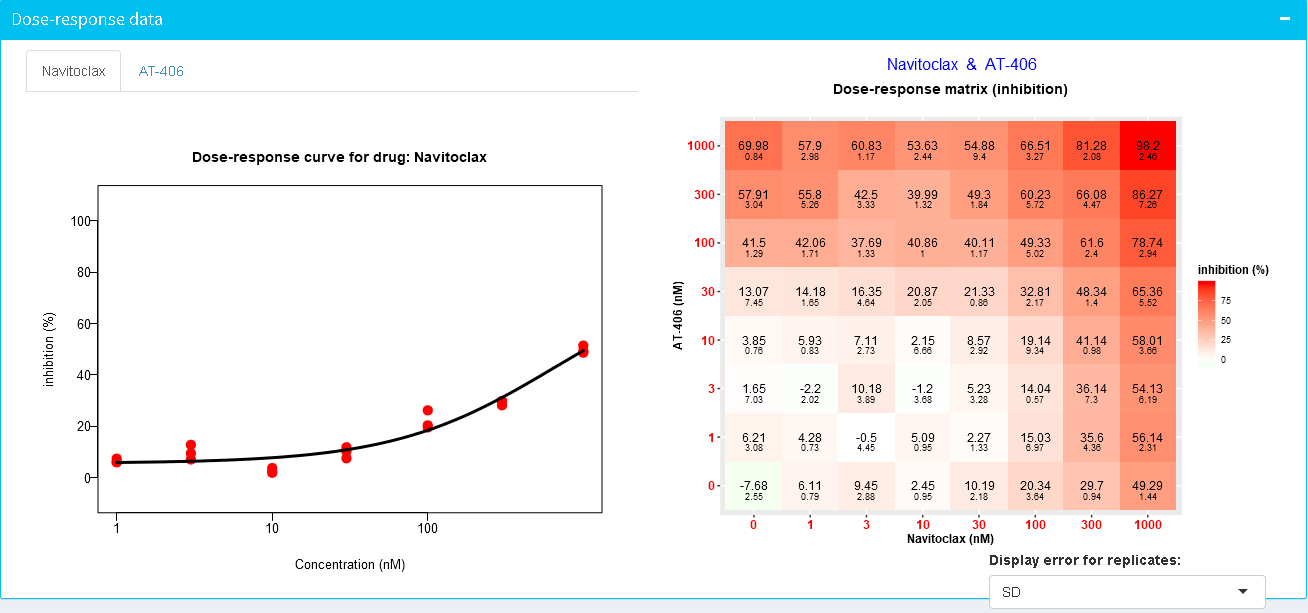
Please note, that SD, SEM and 95% CI are calculated only when 3 or more replicated measurements are provided.
SynergyFinder also calculates a 95% confidence interval for the summary synergy score, but, this requires at least three replicates for each dose-response measurement.
 All the metrics can be exported in the final results table. An example input file with replicate measurements can be found in the example data file.
Multi-sample analysis
SynergyFinder enables analysis and visualization of drug combination synergy across multiple samples. In such multi-sample analyses, a separate "Sample" column should be provided, indicating sample name for each drug combination drug-dose pair (see the example data and figure below). Note, that sample names should not include any special characters or spaces, except hyphen.

In order to export interactive multi-sample analysis visualizations, please click "Save full report" button on the main page, wait ~10 seconds for the pop-up window to load properly and download HTML plots using "Download HTML file" button. The HTML interactive plots will be exported as sharable sinlge HTML files.

SynergyFinder outputs an interactive heatmap that may help to explain the observed synergy patters across either patient samples or cell lines. The interactive heatmap shows the dose-response matrix and synergy map of a particular drug combination by hovering over the value on the heatmap. By clicking on the drug combination name, one can view and compare drug combination plots across all the samples.

In addition, SynergyFinder implements interactive barplots that show synergy results for individual samples that can be generated even for single-sample input data. HTML barplot also enable one to select the most synergistic area (msa) score for visualization and choose among various samples to be analyzed.

The old video briefly outlining SynergyFinder functionality